AI Healthcare Analytics Case Study: Hospital KPI, Revenue & Operations Dashboard
In This Article
- The Challenge: Hospital Data Across Multiple Systems
- Hospital Analytics Workflow Diagram
- OPD to Billing Analytics Workflow
- Hospital KPI and Revenue Dashboard
- Doctor, Patient & Admin Roles
- Doctor Dashboard
- Patient Journey Analytics
- Admin & Management Dashboard
- AI-Assisted Healthcare Analytics
- Multi-Location Hospital Analytics
- Healthcare Analytics Software Services
- Build a Connected Hospital Intelligence Platform
- See Your Hospital Data Differently
- What is an AI healthcare analytics dashboard?
- What hospital KPIs can be tracked?
- Can hospital analytics track revenue?
- Can healthcare analytics measure doctor productivity?
- Can analytics help identify OPD bottlenecks?
- Can the dashboard support multiple hospitals?
- Can laboratory and pharmacy data be included?
- How is AI used in healthcare analytics?
- Who uses hospital analytics dashboards?
- Can healthcare analytics integrate with existing hospital software?
- Conclusion
Hospitals generate large volumes of operational data every day from patient registrations, appointments, OPD queues, doctor consultations, billing, laboratory activity, pharmacy operations, and departmental workflows.
The challenge is not collecting data.
The challenge is turning that data into actionable hospital intelligence.
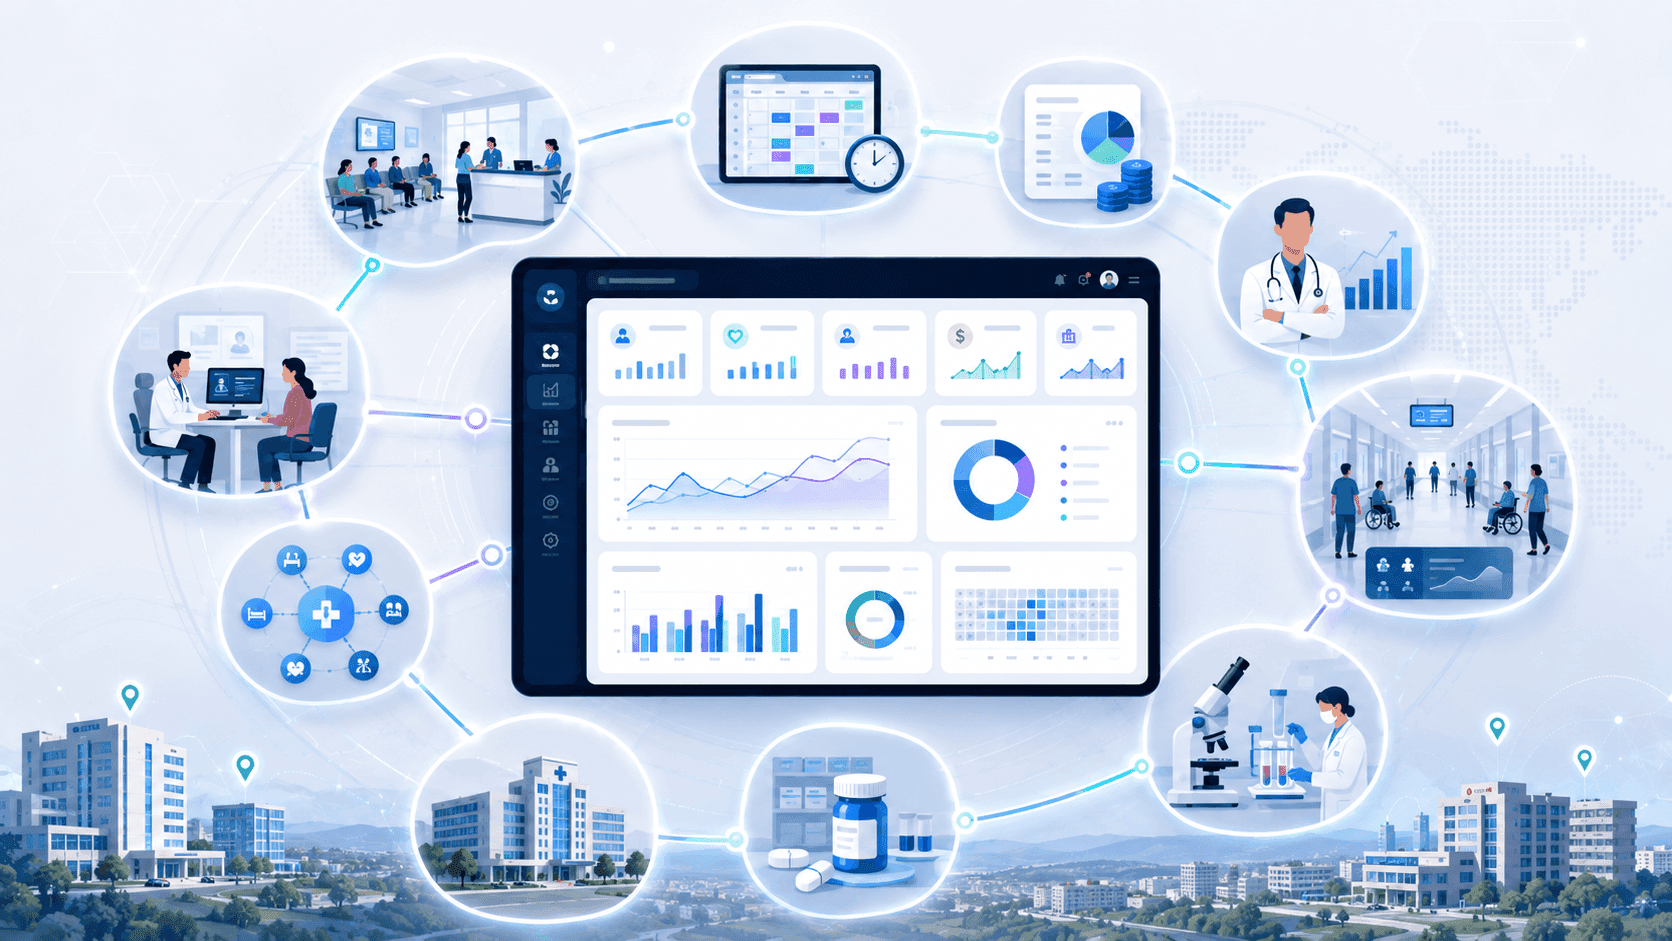
Murmu Software Infotech developed an AI Healthcare Analytics Dashboard that brings hospital KPIs, revenue trends, doctor performance, patient flow, departmental operations, laboratory activity, pharmacy insights, and multi-location reporting into one centralized analytics environment.
The platform gives hospital leadership, administrators, finance teams, operations managers, and department heads a clearer view of performance without depending on fragmented reports.
Organizations planning a connected healthcare platform can also explore our Healthcare Software Development Services.

See Your Hospital Clearly
Unify OPD, revenue, doctors, patient flow, departments and multi-location KPIs through one intelligent healthcare analytics dashboard.
The Challenge: Hospital Data Across Multiple Systems
Hospital information is often distributed across different operational systems.
OPD teams monitor registrations and queues. Doctors manage consultations. Finance teams track billing. Laboratories and pharmacies maintain separate records. Administrators may rely on spreadsheets or manually consolidated reports.
This can create:
- Delayed management reporting
- Limited cross-department visibility
- Difficult revenue comparison
- Poor patient-flow visibility
- Limited doctor-performance insights
- Complex multi-location reporting
- Slow identification of operational bottlenecks
The objective was to create one intelligence layer across hospital operations.
Turn Hospital Data Into Intelligence
Hospital Analytics Workflow Diagram
A connected healthcare analytics workflow can be structured as:
Patient Registration
↓
Appointment / OPD Token
↓
Doctor Consultation
↓
Lab / Pharmacy / Procedures
↓
Billing & Payment
↓
Department Data
↓
Central Analytics Layer
↓
Hospital KPIs & Trends
↓
AI-Assisted Insights
↓
Management Decisions
Instead of treating every department as an isolated reporting source, the dashboard consolidates operational information into measurable hospital KPIs.
Hospitals that need structured digital patient-flow data can connect analytics with OPD Queue Management Software.
OPD to Billing Analytics Workflow
OPD activity is closely connected to hospital revenue and operational performance.
A measurable patient journey can be:
Registration → OPD Queue → Doctor Consultation → Services Ordered → Lab / Pharmacy → Billing → Payment → Follow-Up
Each stage can generate useful analytics.
For example, the hospital can monitor:
- Daily OPD registrations
- Appointment completion
- Doctor consultations
- Department patient volume
- Queue and waiting-time trends
- Services ordered
- Billing value
- Revenue by department
- Payment activity
- Follow-up volume
This allows management to analyze patient flow alongside financial performance rather than reviewing OPD and billing independently.
Hospital KPI and Revenue Dashboard
The analytics dashboard can centralize KPIs such as:
- Daily and monthly OPD volume
- Appointment trends
- Doctor consultation activity
- Department performance
- Revenue trends
- Department-wise revenue
- Billing performance
- Laboratory activity
- Pharmacy sales
- Patient-flow indicators
- Multi-location performance
The live case study already positions centralized reporting, revenue tracking, doctor productivity, patient flow, laboratory and pharmacy reporting, and multi-location KPIs as core capabilities.
Doctor, Patient & Admin Roles
Doctor Dashboard
Doctors can use role-focused analytics to understand:
- Consultation volume
- Appointment completion
- Patient workload
- Specialty activity
- Follow-up patterns
- Department comparisons
For hospitals exploring intelligent consultation workflows, analytics can also connect with AI for Doctors Software Development.
AI should support doctors and administrators with pattern detection, summaries, and operational insights rather than replace clinical judgment.
Patient Journey Analytics
Patients may not need access to management KPIs, but their journey generates important operational data.
Hospitals can analyze:
- Registration-to-consultation flow
- Appointment completion
- Queue movement
- Waiting trends
- Diagnostic activity
- Follow-up patterns
- Service utilization
These insights help operations teams identify where patient journeys slow down or require closer attention.
Admin & Management Dashboard
Hospital administrators and leadership require the broadest operational view.
Dashboards can include:
- Hospital-wide KPIs
- Revenue and billing trends
- Doctor productivity
- Department comparisons
- Patient-flow analytics
- Lab and pharmacy performance
- Location-wise performance
- Operational alerts
- Historical comparisons
Finance teams can focus on revenue and billing, while operations teams can monitor patient movement, departments, and capacity.
Unlock Smarter Hospital Decisions
AI-Assisted Healthcare Analytics
AI adds an interpretation layer on top of conventional dashboards.
The platform can assist with:
- Trend identification
- KPI interpretation
- Anomaly detection
- Operational pattern recognition
- Forecast-oriented insights
- Areas requiring management attention
The purpose is not to allow AI to make hospital decisions automatically.
The value is helping decision-makers detect patterns faster and focus attention where it is needed.
Multi-Location Hospital Analytics
Healthcare groups operating several hospitals or clinics need consistent performance visibility.
A centralized dashboard can compare:
Location → Department → Doctor → Patient Flow → Revenue → KPI
This gives leadership one reporting environment across multiple facilities rather than requiring separate reports from every location.
Organizations that need analytics connected with finance, inventory, procurement, and administration can explore Healthcare ERP Software Development.
Healthcare Analytics Software Services
Build a Connected Hospital Intelligence Platform
Murmu Software Infotech develops custom healthcare analytics platforms for hospitals, clinics, diagnostic centers, and healthcare groups.
Solutions can include:
- Hospital KPI dashboards
- Revenue analytics
- OPD analytics
- Doctor productivity dashboards
- Patient-flow analytics
- Laboratory and pharmacy reporting
- Healthcare ERP analytics
- Multi-location dashboards
- AI-assisted operational insights
- Custom executive reporting
The objective is to connect hospital data with practical management decisions.
See Your Hospital Data Differently
Every healthcare organization measures performance differently.
A live analytics discussion can help identify your KPIs, departments, systems, data sources, reporting needs, user roles, and executive dashboards.
Schedule a Healthcare Analytics Demo to explore how your hospital data can become a connected operational intelligence platform.
What is an AI healthcare analytics dashboard?
It is a centralized platform that combines hospital operational data, KPIs, reporting, and AI-assisted insights to help management monitor performance.
What hospital KPIs can be tracked?
KPIs can include OPD volume, appointments, doctor consultations, revenue, patient flow, department performance, laboratory activity, pharmacy activity, and location-level metrics.
Can hospital analytics track revenue?
Yes. Revenue dashboards can track billing trends, department-wise revenue, payment activity, and financial performance over time.
Can healthcare analytics measure doctor productivity?
Yes. Analytics can include consultation volume, appointment completion, doctor-wise activity, and department productivity.
Can analytics help identify OPD bottlenecks?
Yes. Queue, waiting-time, patient-flow, and department data can help operations teams identify areas requiring attention.
Can the dashboard support multiple hospitals?
Yes. Multi-location analytics can compare facilities, departments, doctors, and operational KPIs from a centralized view.
Can laboratory and pharmacy data be included?
Yes. Laboratory performance, pharmacy sales, inventory movement, and department-level activity can be incorporated.
How is AI used in healthcare analytics?
AI can assist with trend analysis, anomaly detection, KPI interpretation, operational patterns, and forecast-oriented insights.
Who uses hospital analytics dashboards?
Hospital leadership, administrators, operations managers, finance teams, department heads, and authorized clinical users can use role-based dashboards.
Can healthcare analytics integrate with existing hospital software?
Yes. Integration can be designed around existing HMS, ERP, OPD, laboratory, pharmacy, billing, and other data sources depending on system architecture.
Conclusion
An AI Healthcare Analytics Dashboard is more than a collection of charts.
When patient flow, doctor activity, revenue, billing, departments, laboratories, pharmacies, and locations are connected through one analytics layer, hospital leaders gain a clearer view of operational performance.
The result is stronger visibility, faster reporting, better cross-department understanding, and more informed healthcare management decisions.
Frequently Asked Questions
What is an AI healthcare analytics dashboard?
An AI healthcare analytics dashboard combines hospital operational data, KPIs, reporting and AI-assisted insights so leadership can monitor performance, identify trends and make better-informed decisions.
What KPIs should a hospital dashboard track?
Hospital dashboards can track OPD volume, patient registrations, appointments, doctor consultations, revenue, billing, patient flow, department performance, laboratory activity, pharmacy activity and location-level KPIs.
Can hospital analytics track revenue and billing?
Yes. Hospital analytics can monitor billing performance, revenue trends, department-wise revenue, payment activity and financial performance across selected periods and locations.
How is AI used in hospital analytics?
AI can assist with trend detection, KPI interpretation, anomaly identification, operational pattern recognition and forecast-oriented insights while final operational decisions remain with hospital professionals.
Can healthcare analytics measure doctor productivity?
Yes. Doctor analytics can include consultation volume, appointment completion, doctor-wise activity, department productivity and other operational performance indicators.
Can hospital analytics improve patient flow visibility?
Yes. Patient-flow analytics can monitor registrations, queues, wait-time trends, consultations and department movement so operations teams can identify potential bottlenecks.
Can hospital analytics integrate OPD and billing data?
Yes. OPD registrations, consultations, services ordered, billing and payment information can be analyzed together to connect patient activity with financial performance.
Can analytics dashboards include laboratory and pharmacy data?
Yes. Laboratory activity, pharmacy sales, inventory movement and departmental performance can be incorporated into a centralized hospital analytics environment.
Can one dashboard monitor multiple hospitals?
Yes. Multi-location healthcare analytics can consolidate KPIs from several hospitals or clinics and provide facility, department and group-level comparisons.
Can healthcare analytics integrate with existing HMS or ERP software?
Yes. Depending on APIs, databases and system architecture, healthcare analytics can integrate data from HMS, ERP, OPD, billing, laboratory, pharmacy and other healthcare systems.